

If you want AI search to describe your category in your words, the page that does that work is almost never the homepage.
In our State of AI Search for Dev Tools report, blog posts account for 34.3% of citation records. Documentation is second, at 17.3%. Product pages are 7.5%. Landing pages are 2.6%.
Blog posts earn more citations than docs, product pages, and landing pages combined.
That is the finding this series starts with. The report covers 43 developer-tool categories, 478 tracked brands, and 126,814 citation records across a 90-day window from 2 April to 30 June 2026. We asked the same structured evaluation questions every week on ChatGPT Search, Perplexity, Gemini Search, Google AI Mode, and xAI Search.
In this post I’ll cover what “blog post” actually means in that mix, why homepages still matter even when they barely get cited, where this pattern is strongest, and what to write next if you only have one sprint.
What the mix looks like
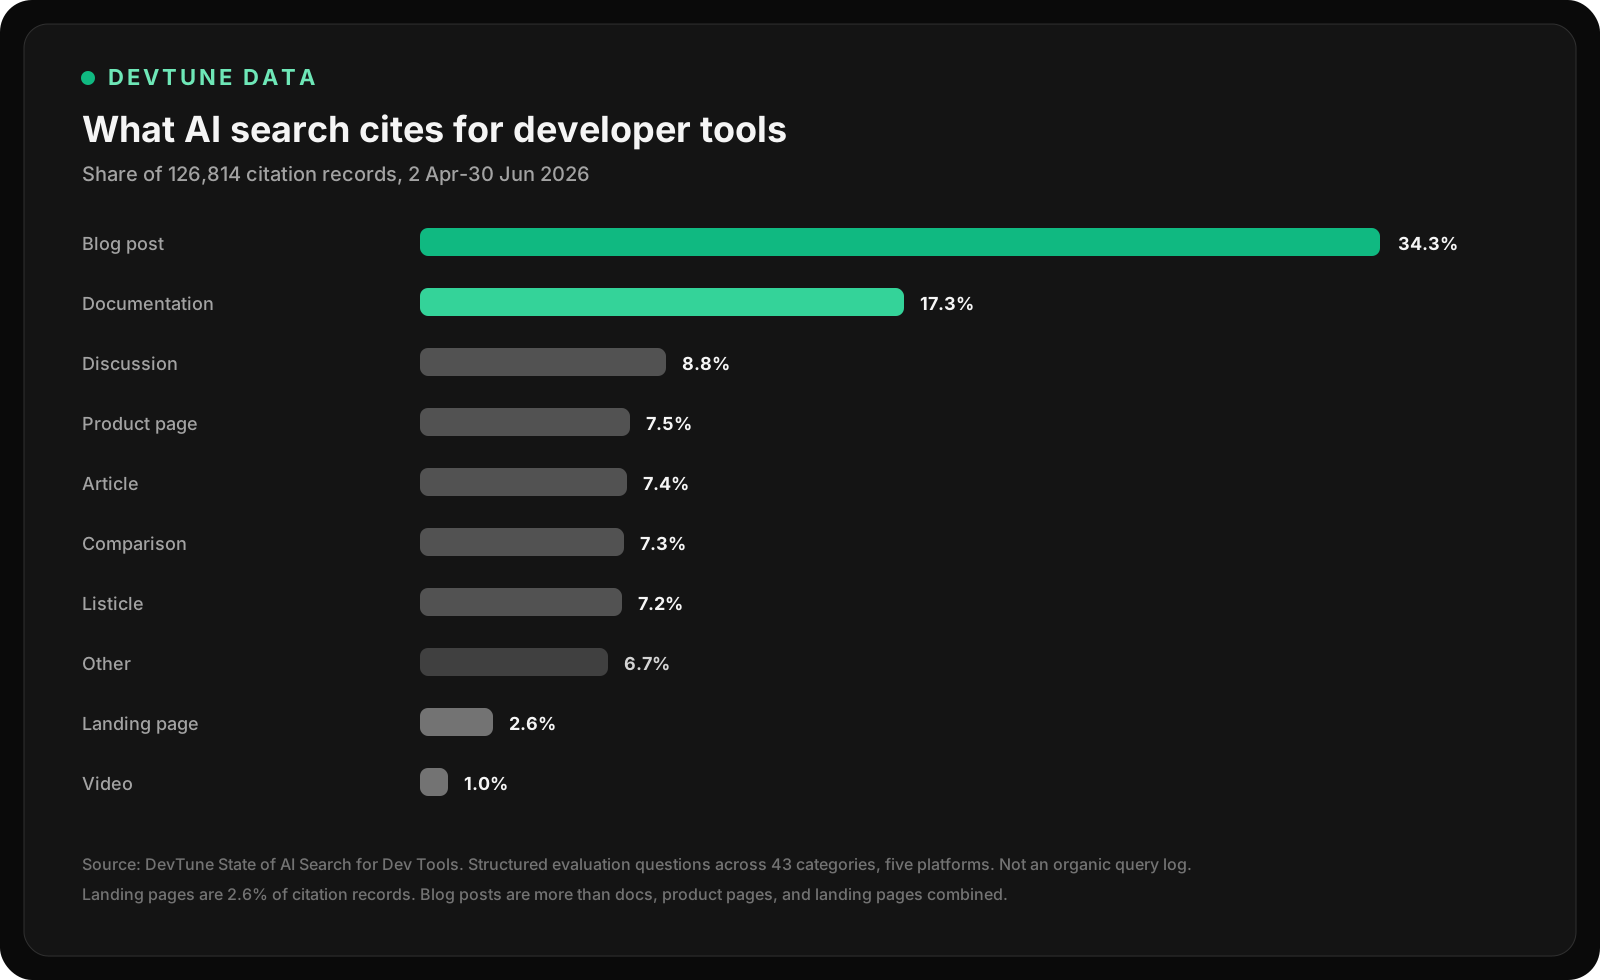
Share of 126,814 citation records by classified content type. Fixed 90-day window, 2 April to 30 June 2026.
| Content type | Share of citation records |
|---|---|
| Blog post | 34.3% |
| Documentation | 17.3% |
| Discussion | 8.8% |
| Product page | 7.5% |
| Article | 7.4% |
| Comparison | 7.3% |
| Listicle | 7.2% |
| Other | 6.7% |
| Landing page | 2.6% |
| Video | 1.0% |
A few things this table does not say.
It does not say “write more blogs.” Thin ranking posts that put you first and everyone else in a footnote are not what shows up in the most-cited URLs. The pages that recur are explainers, market overviews, and comparisons that name criteria.
It does not say docs are optional. Docs are the second most-cited type overall, and they jump in hands-on categories. API Development & Management is 39.6% documentation. Documentation & Developer Portals is 37.5%. We will come back to that in a later post.
It does not say your homepage failed. The homepage still tells a human, and an engine, what the company is. It is a poor place to park the evidence an answer needs to quote.
Why the homepage loses the citation
An AI answer that compares tools needs something a homepage is designed not to do: pick a job, state the tradeoffs, and survive being quoted out of context.
A homepage has to work for every visitor. Pricing, hiring, product shots, social proof, the category slogan. That is orientation. It is not a self-contained answer to “which secrets manager supports rotation, Kubernetes, and a decent CLI?”
The pages that get cited do that job. They explain the category. They list selection criteria. They say who a tool fits. They include a date, a method, or a worked example. You can lift a paragraph from them into an answer and it still makes sense.
That is why “blog post” leads the mix. In this dataset the label is a classifier for long-form pages on a site: explainers, roundups, how-tos, vendor market guides. It is not a verdict on your editorial calendar.
Note: the report-wide mix is a benchmark, not a picture of your brand. A company’s cited sources can look nothing like the aggregate. Clerk’s growth team told us their citations skew to docs. Railway’s founding growth marketer told us their cited sources are mostly user-generated. Both can be true in the same market. Measure your own answers.
Where blogs take the largest share
The report-wide 34.3% hides a lot of category variation. Blog share is highest in:
| Category | Blog share |
|---|---|
| Testing & QA | 46.1% |
| Infrastructure as Code | 46.0% |
| Mobile Development Platforms & Cross-Platform | 45.5% |
| Data Engineering & ETL/ELT Pipelines | 44.0% |
| Internal Developer Platforms | 41.4% |
| Containers & Orchestration | 41.1% |
These are categories buyers research with “best X”, “X vs Y”, and “how do I choose” questions. The web already has a lot of that writing, so engines have a lot of it to cite.
If you sell into one of those categories and your public site is a homepage, a product page, and a docs portal, you are asking the engine to invent the comparison layer. It will not invent it from your hero copy. It will use someone else’s post.
What to write instead of “more content”
If you take one action from this post, take this: pick the buyer question you most want to own, and write a page that fully answers it.
Use the question as the title. Answer it in the first paragraph. Then do the work the homepage cannot:
- Name the job, not just the category.
- List the criteria you want to be judged on.
- Show tradeoffs, including cases where another tool is a better fit.
- Link the claims to docs, examples, or a changelog, so the page is checkable.
- Put a date on it and keep it current. Fresh “best X in 2026” pages show up again and again among the most-cited URLs.
That page can live on the blog. It can also be a comparison hub, an alternatives page, or a docs guide. The classifier will call some of those “blog post” and some “comparison” or “documentation.” The unit that matters is a page that can stand alone as a source.
Do not:
- Replace the homepage. Keep it clear. Make the claims on it true on the deeper pages.
- Ship a monthly “thought leadership” post that never names a criterion.
- Rank yourself #1 in a list of ten and call it research.
Where this finding fails
Two caveats, both in the methodology on purpose.
The question set is a structured evaluation instrument, not a log of what developers typed yesterday. We designed it to stress comparison and implementation questions, because that is how tools get shortlisted. A sample built only from brand-name queries would look more like a vanity report.
Content type is classified, so the 34.3% is only as good as the labels. A docs-like explainer on a blog subdomain still counts as a blog post. A marketing page that happens to sit on /docs can get counted as documentation. Use the mix as a direction, then open the actual cited URLs for your category.
And landing pages at 2.6% does not mean campaigns are useless. It means the page that closes a paid click is rarely the page an answer engine quotes.
Summary
AI search, for developer tools, cites the pages that explain and compare. Those pages are usually blog posts in the data. They are almost never landing pages.
Keep the homepage as orientation. Put the quotable answer on a page built for one question, with criteria, tradeoffs, and proof.
The full tables, category heatmap, and platform splits are in the State of AI Search for Dev Tools report. Next in this series: the same dataset, split by engine, because a blended “AI visibility” number hides five different jobs.